
Map your meal
Choose ingredients and explore the regions producing them.
↗MAPIFYSTATS / FOOD & AGRICULTURE
Explore crops, livestock and the agricultural regions behind your ingredients.
Map your meal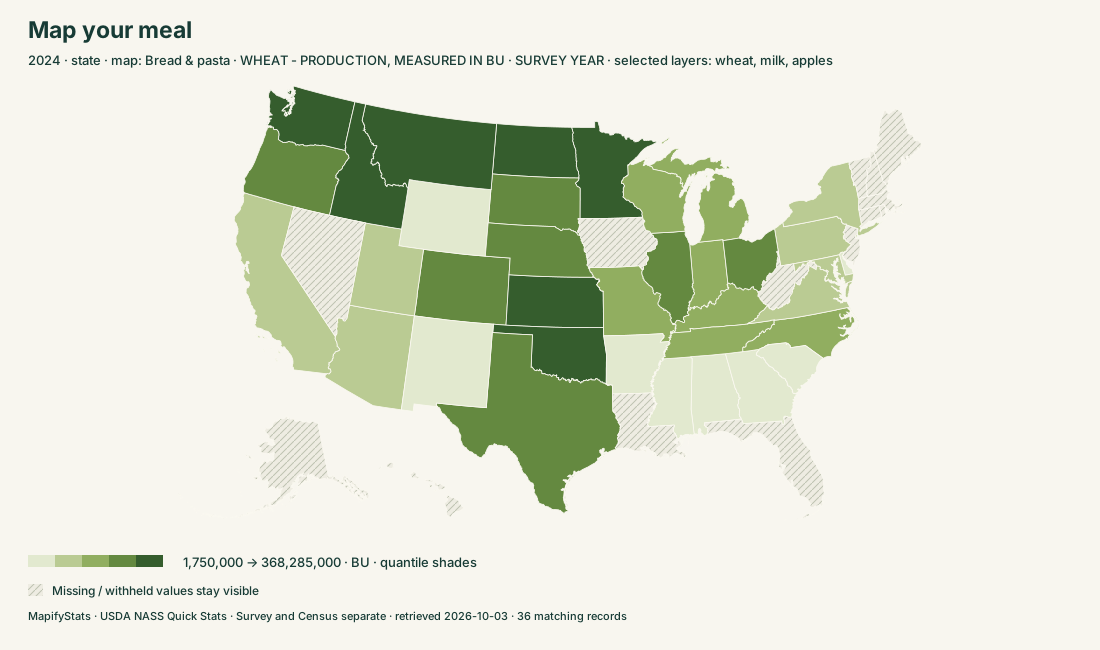
SIX WAYS INTO THE ATLAS
Choose a place. Read the record. Take the map with you.
Choose ingredients and explore the regions producing them.
↗Compare reported acreage, production and yield by commodity and year.
↗Explore inventories, milk, eggs and published animal-product measures.
↗Explore the crops and products that distinguish a place.
↗Compare farms, agricultural acreage and farm structure across censuses.
↗Put comparable county and state agricultural records alongside each other.
↗PLACES & STORIES
165 substantive profiles. Every covered place remains searchable in the explorers.
READ THE RECORD
USDA NASS Quick Stats · Survey and Census separate · retrieved 2026-10-03
USDA NASS Quick Stats survey observations cover 2019–2025; Census of Agriculture records cover 2017 and 2022. Annual TOTAL-domain whole-product measures are reviewed for this launch. Class, production/utilization practice, reference period, program and units form an exact measure identity. Forecast periods, overlapping size/domain subtotals and organic subsets are excluded. Some market-specific products remain separately labeled.
(D) means withheld, (Z) means below the source publication threshold, and unavailable values remain separate from recorded zero. Suppressed values are never reconstructed. Official state totals are independent of county records. Combined or historic county entities preserve their source identity and may have no map point. Crop production and livestock inventory are different measures; units across ingredient layers are never added. Missing selected years are not filled from another year.
Ingredient maps explain producing regions, not the origin of a particular purchased food. County production is unavailable for some ingredients; use official state totals. Specialization shows each product’s share of an independently published official state/national total; a missing denominator stays unavailable. Farmland changes compare the same Census measure in 2017 and 2022; a zero baseline has no percentage change.