
Local Data Atlas / Education & community
Student Debt by State
Compare federal student-loan balances, borrower counts and average balances by state.
2026-03-31 · Snapshot retrieved 2026-10-02
Saved example · 51 matching places. Interactive filters load automatically.
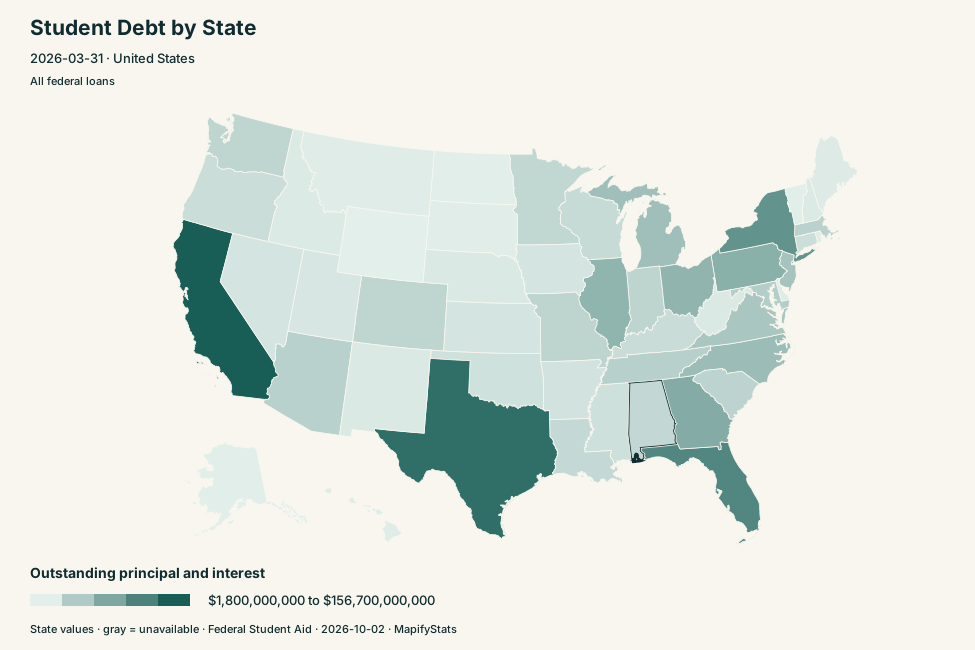
51 plotted of 51 matching places. Outstanding principal and interest: $1,800,000,000 to $156,700,000,000. State values; county-point averages are only fallback label coordinates. Gray means unavailable; exact values follow in the table.
Selected place
Alabama, AL
AL · 2026-03-31
$26,000,000,000
Outstanding principal and interest
- Outstanding principal and interest
- $26,000,000,000
- Reported borrowers
- 664,000
- Average balance per borrower
- $39,157
Comparison
Alaska, AK
AK · 2026-03-31
$2,400,000,000
Outstanding principal and interest
- Outstanding principal and interest
- $2,400,000,000
- Reported borrowers
- 64,500
- Average balance per borrower
- $37,209
National history, separately reported
Historical state values are unavailable in this source. This series describes the nation. Fiscal-year quarters preserve the source labels.
Federal portfolio over time
National outstanding principal and interest · missing observations break the line
- National all-federal-loan balance
Show exact timeline values
| Period | National all-federal-loan balance |
|---|---|
| FY2007 year-end | $516,000,000,000 |
| FY2008 year-end | $577,000,000,000 |
| FY2009 year-end | $657,000,000,000 |
| FY2010 year-end | $749,800,000,000 |
| FY2011 year-end | $848,200,000,000 |
| FY2012 year-end | $948,200,000,000 |
| FY2013 Q1 | $961,900,000,000 |
| FY2013 Q2 | $998,600,000,000 |
| FY2013 Q3 | $1,006,800,000,000 |
| FY2013 Q4 | $1,040,200,000,000 |
| FY2014 Q1 | $1,051,800,000,000 |
| FY2014 Q2 | $1,087,000,000,000 |
| FY2014 Q3 | $1,096,500,000,000 |
| FY2014 Q4 | $1,129,800,000,000 |
| FY2015 Q1 | $1,140,100,000,000 |
| FY2015 Q2 | $1,174,400,000,000 |
| FY2015 Q3 | $1,182,100,000,000 |
| FY2015 Q4 | $1,212,400,000,000 |
| FY2016 Q1 | $1,220,300,000,000 |
| FY2016 Q2 | $1,254,900,000,000 |
| FY2016 Q3 | $1,262,200,000,000 |
| FY2016 Q4 | $1,292,200,000,000 |
| FY2017 Q1 | $1,299,700,000,000 |
| FY2017 Q2 | $1,331,700,000,000 |
| FY2017 Q3 | $1,337,400,000,000 |
| FY2017 Q4 | $1,366,900,000,000 |
| FY2018 Q1 | $1,375,500,000,000 |
| FY2018 Q2 | $1,407,100,000,000 |
| FY2018 Q3 | $1,412,000,000,000 |
| FY2018 Q4 | $1,439,200,000,000 |
| FY2019 Q1 | $1,447,100,000,000 |
| FY2019 Q2 | $1,476,600,000,000 |
| FY2019 Q3 | $1,481,100,000,000 |
| FY2019 Q4 | $1,510,300,000,000 |
| FY2020 Q1 | $1,515,000,000,000 |
| FY2020 Q2 | $1,542,700,000,000 |
| FY2020 Q3 | $1,544,800,000,000 |
| FY2020 Q4 | $1,566,300,000,000 |
| FY2021 Q1 | $1,565,200,000,000 |
| FY2021 Q2 | $1,591,800,000,000 |
| FY2021 Q3 | $1,591,100,000,000 |
| FY2021 Q4 | $1,610,700,000,000 |
| FY2022 Q1 | $1,606,400,000,000 |
| FY2022 Q2 | $1,619,700,000,000 |
| FY2022 Q3 | $1,617,300,000,000 |
| FY2022 Q4 | $1,634,500,000,000 |
| FY2023 Q1 | $1,635,400,000,000 |
| FY2023 Q2 | $1,644,500,000,000 |
| FY2023 Q3 | $1,633,800,000,000 |
| FY2023 Q4 | $1,602,200,000,000 |
| FY2024 Q1 | $1,598,400,000,000 |
| FY2024 Q2 | $1,620,100,000,000 |
| FY2024 Q3 | $1,611,000,000,000 |
| FY2024 Q4 | $1,638,600,000,000 |
| FY2025 Q1 | $1,639,635,917,496 |
| FY2025 Q2 | $1,660,700,000,000 |
| FY2025 Q3 | $1,665,600,000,000 |
| FY2025 Q4 | $1,692,600,000,000 |
| FY2026 Q1 | $1,696,300,000,000 |
| FY2026 Q2 | $1,723,900,000,000 |
| FY2026 Q3 | $1,724,500,000,000 |
National recipient counts and approximate balance per recipient
| Fiscal period | Recipients (not borrowers) | Approximate balance per recipient |
|---|---|---|
| FY2007 year-end | 28,300,000 | $18,233 |
| FY2008 year-end | 29,900,000 | $19,298 |
| FY2009 year-end | 32,100,000 | $20,467 |
| FY2010 year-end | 34,300,000 | $21,860 |
| FY2011 year-end | 36,500,000 | $23,238 |
| FY2012 year-end | 38,300,000 | $24,757 |
| FY2013 Q1 | 38,700,000 | $24,855 |
| FY2013 Q2 | 38,900,000 | $25,671 |
| FY2013 Q3 | 38,700,000 | $26,016 |
| FY2013 Q4 | 39,600,000 | $26,268 |
| FY2014 Q1 | 40,000,000 | $26,295 |
| FY2014 Q2 | 40,000,000 | $27,175 |
| FY2014 Q3 | 39,900,000 | $27,481 |
| FY2014 Q4 | 40,700,000 | $27,759 |
| FY2015 Q1 | 41,100,000 | $27,740 |
| FY2015 Q2 | 41,000,000 | $28,644 |
| FY2015 Q3 | 40,800,000 | $28,973 |
| FY2015 Q4 | 41,600,000 | $29,144 |
| FY2016 Q1 | 41,800,000 | $29,194 |
| FY2016 Q2 | 41,700,000 | $30,094 |
| FY2016 Q3 | 41,500,000 | $30,414 |
| FY2016 Q4 | 42,300,000 | $30,548 |
| FY2017 Q1 | 42,400,000 | $30,653 |
| FY2017 Q2 | 42,300,000 | $31,482 |
| FY2017 Q3 | 42,000,000 | $31,843 |
| FY2017 Q4 | 42,600,000 | $32,087 |
| FY2018 Q1 | 42,800,000 | $32,138 |
| FY2018 Q2 | 42,600,000 | $33,031 |
| FY2018 Q3 | 42,200,000 | $33,460 |
| FY2018 Q4 | 42,900,000 | $33,548 |
| FY2019 Q1 | 43,000,000 | $33,653 |
| FY2019 Q2 | 42,800,000 | $34,500 |
| FY2019 Q3 | 42,200,000 | $35,097 |
| FY2019 Q4 | 42,900,000 | $35,205 |
| FY2020 Q1 | 42,800,000 | $35,397 |
| FY2020 Q2 | 42,600,000 | $36,214 |
| FY2020 Q3 | 42,300,000 | $36,520 |
| FY2020 Q4 | 42,900,000 | $36,510 |
| FY2021 Q1 | 42,900,000 | $36,485 |
| FY2021 Q2 | 42,900,000 | $37,105 |
| FY2021 Q3 | 42,800,000 | $37,175 |
| FY2021 Q4 | 43,400,000 | $37,113 |
| FY2022 Q1 | 43,400,000 | $37,014 |
| FY2022 Q2 | 43,000,000 | $37,667 |
| FY2022 Q3 | 42,800,000 | $37,787 |
| FY2022 Q4 | 43,500,000 | $37,575 |
| FY2023 Q1 | 43,800,000 | $37,338 |
| FY2023 Q2 | 43,600,000 | $37,718 |
| FY2023 Q3 | 43,400,000 | $37,645 |
| FY2023 Q4 | 43,200,000 | $37,088 |
| FY2024 Q1 | 43,100,000 | $37,086 |
| FY2024 Q2 | 42,800,000 | $37,853 |
| FY2024 Q3 | 42,200,000 | $38,175 |
| FY2024 Q4 | 42,700,000 | $38,375 |
| FY2025 Q1 | 42,790,504 | $38,318 |
| FY2025 Q2 | 42,500,000 | $39,075 |
| FY2025 Q3 | 42,300,000 | $39,376 |
| FY2025 Q4 | 42,800,000 | $39,547 |
| FY2026 Q1 | 42,800,000 | $39,633 |
| FY2026 Q2 | 42,600,000 | $40,467 |
| FY2026 Q3 | 42,300,000 | $40,768 |
Compare the data
Choose a place name to inspect its profile. CSV downloads include every matching row; the table shows 40 rows at a time.
Scroll horizontally to see every column →
| Place | Identifier | State | Outstanding principal and interest |
|---|---|---|---|
| California | CA | CA | $156,700,000,000 |
| Texas | TX | TX | $138,300,000,000 |
| Florida | FL | FL | $113,100,000,000 |
| New York | NY | NY | $99,900,000,000 |
| Georgia | GA | GA | $74,600,000,000 |
| Pennsylvania | PA | PA | $69,600,000,000 |
| Illinois | IL | IL | $65,300,000,000 |
| Ohio | OH | OH | $64,300,000,000 |
| North Carolina | NC | NC | $55,800,000,000 |
| Michigan | MI | MI | $53,200,000,000 |
| New Jersey | NJ | NJ | $48,400,000,000 |
| Virginia | VA | VA | $45,500,000,000 |
| Maryland | MD | MD | $38,400,000,000 |
| Tennessee | TN | TN | $34,600,000,000 |
| Arizona | AZ | AZ | $34,000,000,000 |
| Massachusetts | MA | MA | $33,400,000,000 |
| South Carolina | SC | SC | $31,400,000,000 |
| Indiana | IN | IN | $31,000,000,000 |
| Missouri | MO | MO | $30,600,000,000 |
| Colorado | CO | CO | $29,700,000,000 |
| Washington | WA | WA | $29,600,000,000 |
| Minnesota | MN | MN | $27,500,000,000 |
| Alabama | AL | AL | $26,000,000,000 |
| Louisiana | LA | LA | $25,100,000,000 |
| Wisconsin | WI | WI | $24,000,000,000 |
| Kentucky | KY | KY | $21,600,000,000 |
| Oregon | OR | OR | $20,800,000,000 |
| Connecticut | CT | CT | $19,800,000,000 |
| Mississippi | MS | MS | $17,800,000,000 |
| Oklahoma | OK | OK | $17,100,000,000 |
| Arkansas | AR | AR | $14,500,000,000 |
| Iowa | IA | IA | $13,500,000,000 |
| Nevada | NV | NV | $13,200,000,000 |
| Kansas | KS | KS | $13,100,000,000 |
| Utah | UT | UT | $11,100,000,000 |
| Nebraska | NE | NE | $8,200,000,000 |
| New Mexico | NM | NM | $8,000,000,000 |
| West Virginia | WV | WV | $7,700,000,000 |
| Idaho | ID | ID | $7,500,000,000 |
| New Hampshire | NH | NH | $6,800,000,000 |
How to read these numbers
March 31, 2026 state snapshot, with separately labeled national fiscal-year/quarter history. The source does not supply a historical state series. State borrower locations come from loan servicers. Categories overlap; never add all federal, Direct Loan and income-driven repayment rows. Averages divide rounded source balances by rounded borrower counts and are approximate. National recipients differ from borrowers (notably parent PLUS), so national trends use the original recipient label. Private student loans are outside this source.
Map colors span the minimum and maximum available values in your current filters. Point maps locate reference points and do not shade geographic boundaries. Nearby ordering uses straight-line point distance, not a travel route. Public links preserve statistical filters and place identifiers; calculation amounts and search text stay out of the URL.
Sources and reproducibility
Retrieved 2026-10-02. Archived extracts, original-download SHA-256 checksums and exact selection rules are preserved in the source manifest. Normal builds use these saved files offline.
Download the saved source snapshot · Download the saved comparison CSV
Agency sources and archived files (4)
- Portfolio-by-Location.xls · official source · Archived file
Unchanged FSA workbook including definitions. State values convert published billions/thousands to dollars/borrowers. March 31, 2026 snapshot; overseas/unknown locations excluded.
- DLPortfolio-by-Location.xls · official source · Archived file
Unchanged FSA workbook including definitions. State values convert published billions/thousands to dollars/borrowers. March 31, 2026 snapshot; overseas/unknown locations excluded.
- IDRPortfolio-by-Location.xls · official source · Archived file
Unchanged FSA workbook including definitions. State values convert published billions/thousands to dollars/borrowers. March 31, 2026 snapshot; overseas/unknown locations excluded.
- PortfolioSummary.xls · official source · Archived file
Unchanged national historical workbook. Fiscal-year/quarter labels are preserved. Recipients are not state-table borrowers and are not interchangeable, including parent PLUS loans.