
MAPIFYSTATS / ANIMATED MAPS / 02
Harvey (2017): Atlantic track and wind history
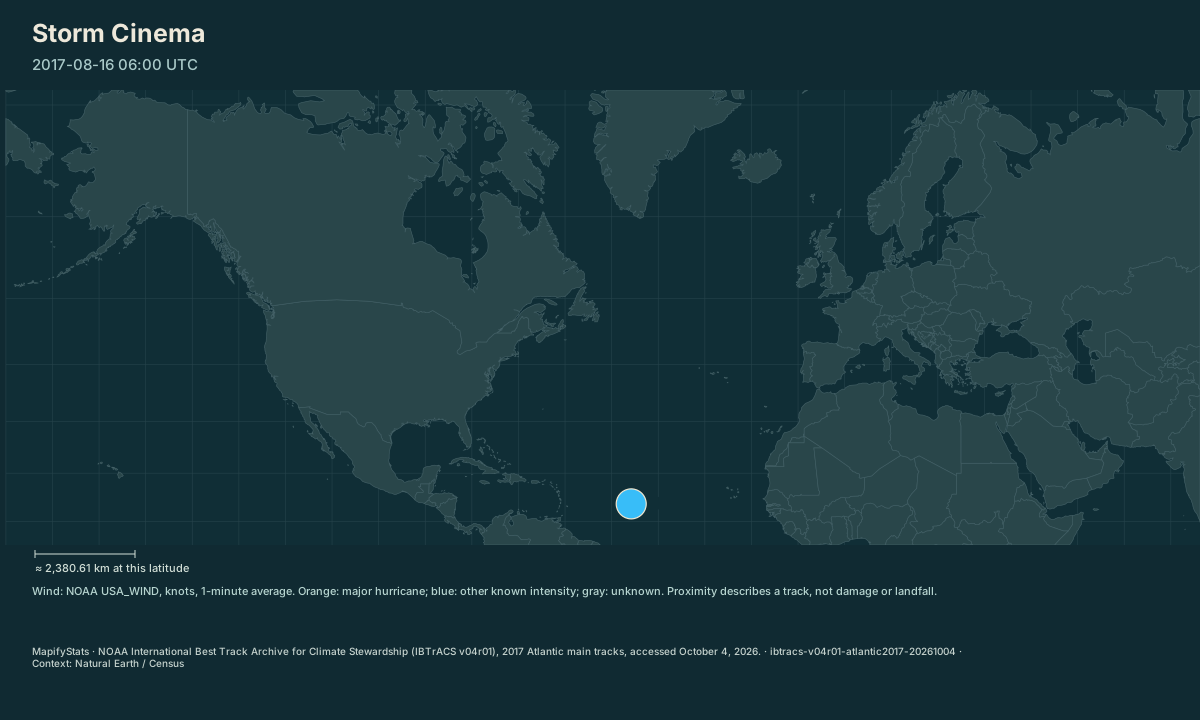
Replay the Atlantic, observation by observation. Replay historical Atlantic storm centers and intensity. Inspect track proximity to a selected city without confusing it with landfall or damage.
NOAA International Best Track Archive for Climate Stewardship (IBTrACS v04r01), 2017 Atlantic main tracks, accessed October 4, 2026. · Source release, rights & limitations
1 historical Atlantic track from the 2017 season. Centers interpolate between observations; wind remains tied to the latest NOAA observation.
| Place / record | Value | Definition |
|---|---|---|
| Harvey | 25 knots |
The opening frame and source values work without JavaScript. Enable JavaScript to play, select places, compare or export.
NOAA International Best Track Archive for Climate Stewardship (IBTrACS v04r01), 2017 Atlantic main tracks, accessed October 4, 2026. · Source release, rights & limitations
Follow Irma through the archived 2017 Atlantic observations. The center travels between source times; wind labels remain attached to actual observations.
NOAA International Best Track Archive for Climate Stewardship (IBTrACS v04r01), 2017 Atlantic main tracks, accessed October 4, 2026. · Source release, rights & limitations
Synchronized comparison
Both maps share replay progress and geographic scale. Source periods appear in each title. Formation-aligned storm comparison uses the storm controls.
What the map shows
1 historical Atlantic track from the 2017 season. Centers interpolate between observations; wind remains tied to the latest NOAA observation.
Drag to explore; manual map movement releases guided following. Particle movement and travel progress are illustrative. Attribution stays with every exported image.
Share this replay
Links include your selected public places, time, camera and exact source version. Review your selections before sharing.
Browser video recording is best effort, at 12 fps. A poster remains available when video capture is unsupported.
Accessible source values
| Place / record | Value | Definition |
|---|---|---|
| Harvey | 25 knots |
Accessible comparison values
Historical summary
Harvey's bundled Atlantic track contains 74 archived observations, from 2017-08-16 06:00 UTC to 2017-09-02 12:00 UTC. The highest recorded NOAA USA_WIND was 115 knots at 2017-08-26 00:00 UTC (Category 4). The lowest reported central pressure was 937 hPa at 2017-08-26 03:00 UTC.
The timeline preserves recorded positions, cyclone stages, 1-minute average winds and reported central pressures. Unavailable readings remain explicit. These observations describe the storm center; they do not establish local damage, rainfall, landfall or a forecast. Playback interpolates positions; the timeline lists only source observations. Source release and limitations.
Historical source timeline
Values are rounded to two decimals for display; the bundled source scene retains source precision. Scroll the timeline to inspect every observation.
| Observed at (UTC) | Longitude | Latitude | NOAA wind (knots) | Central pressure (hPa) | Recorded stage / intensity |
|---|---|---|---|---|---|
| 2017-08-16 06:00 UTC | -45.8 | 13.7 | 25 | 1,013 | LO · Other cyclone stage |
| 2017-08-16 12:00 UTC | -47.4 | 13.7 | 25 | 1,010 | LO · Other cyclone stage |
| 2017-08-16 18:00 UTC | -49 | 13.6 | 25 | 1,009 | LO · Other cyclone stage |
| 2017-08-17 00:00 UTC | -50.6 | 13.6 | 25 | 1,010 | LO · Other cyclone stage |
| 2017-08-17 06:00 UTC | -52 | 13.4 | 25 | 1,008 | TD · Tropical / subtropical depression |
| 2017-08-17 12:00 UTC | -53.4 | 13.1 | 30 | 1,008 | TD · Tropical / subtropical depression |
| 2017-08-17 18:00 UTC | -55 | 13 | 35 | 1,004 | TS · Tropical / subtropical storm |
| 2017-08-18 00:00 UTC | -56.6 | 13 | 40 | 1,003 | TS · Tropical / subtropical storm |
| 2017-08-18 06:00 UTC | -58.4 | 13 | 40 | 1,004 | TS · Tropical / subtropical storm |
| 2017-08-18 10:00 UTC | -59.6 | 13.1 | 40 | 1,004 | TS · Tropical / subtropical storm |
| 2017-08-18 12:00 UTC | -60.3 | 13.1 | 40 | 1,004 | TS · Tropical / subtropical storm |
| 2017-08-18 15:00 UTC | -61.2 | 13.2 | 40 | 1,004 | TS · Tropical / subtropical storm |
| 2017-08-18 18:00 UTC | -62.2 | 13.2 | 35 | 1,005 | TS · Tropical / subtropical storm |
| 2017-08-19 00:00 UTC | -64 | 13.4 | 35 | 1,005 | TS · Tropical / subtropical storm |
| 2017-08-19 06:00 UTC | -65.7 | 13.5 | 35 | 1,005 | TS · Tropical / subtropical storm |
| 2017-08-19 12:00 UTC | -67.5 | 13.7 | 30 | 1,006 | TD · Tropical / subtropical depression |
| 2017-08-19 18:00 UTC | -69.2 | 13.8 | 30 | 1,007 | WV · Other cyclone stage |
| 2017-08-20 00:00 UTC | -71 | 14 | 30 | 1,007 | WV · Other cyclone stage |
| 2017-08-20 06:00 UTC | -72.9 | 14.2 | 30 | 1,007 | WV · Other cyclone stage |
| 2017-08-20 12:00 UTC | -75 | 14.4 | 30 | 1,006 | WV · Other cyclone stage |
| 2017-08-20 18:00 UTC | -76.8 | 14.7 | 30 | 1,007 | WV · Other cyclone stage |
| 2017-08-21 00:00 UTC | -78.6 | 15.1 | 25 | 1,007 | WV · Other cyclone stage |
| 2017-08-21 06:00 UTC | -80.5 | 15.7 | 25 | 1,008 | WV · Other cyclone stage |
| 2017-08-21 12:00 UTC | -82.5 | 16.4 | 25 | 1,008 | WV · Other cyclone stage |
| 2017-08-21 18:00 UTC | -84.6 | 17.3 | 25 | 1,008 | WV · Other cyclone stage |
| 2017-08-22 00:00 UTC | -86.4 | 18 | 25 | 1,008 | WV · Other cyclone stage |
| 2017-08-22 06:00 UTC | -87.8 | 18.6 | 25 | 1,009 | WV · Other cyclone stage |
| 2017-08-22 12:00 UTC | -88.8 | 19.4 | 25 | 1,010 | WV · Other cyclone stage |
| 2017-08-22 18:00 UTC | -89.7 | 20 | 25 | 1,010 | LO · Other cyclone stage |
| 2017-08-23 00:00 UTC | -90.7 | 20.5 | 25 | 1,009 | LO · Other cyclone stage |
| 2017-08-23 06:00 UTC | -91.6 | 20.9 | 25 | 1,008 | LO · Other cyclone stage |
| 2017-08-23 12:00 UTC | -92.3 | 21.4 | 30 | 1,006 | TD · Tropical / subtropical depression |
| 2017-08-23 18:00 UTC | -92.4 | 21.6 | 35 | 1,005 | TS · Tropical / subtropical storm |
| 2017-08-24 00:00 UTC | -92.5 | 22 | 40 | 1,003 | TS · Tropical / subtropical storm |
| 2017-08-24 06:00 UTC | -92.6 | 22.8 | 50 | 997 | TS · Tropical / subtropical storm |
| 2017-08-24 12:00 UTC | -93.1 | 23.7 | 60 | 986 | TS · Tropical / subtropical storm |
| 2017-08-24 18:00 UTC | -93.6 | 24.4 | 70 | 978 | HU · Category 1 |
| 2017-08-25 00:00 UTC | -94.4 | 25 | 80 | 973 | HU · Category 1 |
| 2017-08-25 06:00 UTC | -95.1 | 25.6 | 90 | 966 | HU · Category 2 |
| 2017-08-25 12:00 UTC | -95.8 | 26.3 | 95 | 949 | HU · Category 2 |
| 2017-08-25 18:00 UTC | -96.3 | 27.1 | 105 | 943 | HU · Category 3 |
| 2017-08-26 00:00 UTC | -96.8 | 27.8 | 115 | 941 | HU · Category 4 |
| 2017-08-26 03:00 UTC | -96.9 | 28 | 115 | 937 | HU · Category 4 |
| 2017-08-26 06:00 UTC | -97.1 | 28.2 | 105 | 948 | HU · Category 3 |
| 2017-08-26 12:00 UTC | -97.3 | 28.7 | 65 | 978 | HU · Category 1 |
| 2017-08-26 18:00 UTC | -97.5 | 29 | 50 | 991 | TS · Tropical / subtropical storm |
| 2017-08-27 00:00 UTC | -97.4 | 29.2 | 45 | 995 | TS · Tropical / subtropical storm |
| 2017-08-27 06:00 UTC | -97.6 | 29.3 | 40 | 998 | TS · Tropical / subtropical storm |
| 2017-08-27 12:00 UTC | -97.5 | 29.1 | 35 | 998 | TS · Tropical / subtropical storm |
| 2017-08-27 18:00 UTC | -97.2 | 29 | 35 | 998 | TS · Tropical / subtropical storm |
| 2017-08-28 00:00 UTC | -96.8 | 28.8 | 35 | 997 | TS · Tropical / subtropical storm |
| 2017-08-28 06:00 UTC | -96.5 | 28.6 | 40 | 997 | TS · Tropical / subtropical storm |
| 2017-08-28 12:00 UTC | -96.2 | 28.5 | 40 | 997 | TS · Tropical / subtropical storm |
| 2017-08-28 18:00 UTC | -95.9 | 28.4 | 40 | 997 | TS · Tropical / subtropical storm |
| 2017-08-29 00:00 UTC | -95.4 | 28.2 | 40 | 996 | TS · Tropical / subtropical storm |
| 2017-08-29 06:00 UTC | -95 | 28.1 | 40 | 996 | TS · Tropical / subtropical storm |
| 2017-08-29 12:00 UTC | -94.6 | 28.2 | 40 | 995 | TS · Tropical / subtropical storm |
| 2017-08-29 18:00 UTC | -94.2 | 28.5 | 45 | 993 | TS · Tropical / subtropical storm |
| 2017-08-30 00:00 UTC | -93.8 | 28.9 | 45 | 994 | TS · Tropical / subtropical storm |
| 2017-08-30 06:00 UTC | -93.6 | 29.4 | 40 | 990 | TS · Tropical / subtropical storm |
| 2017-08-30 08:00 UTC | -93.5 | 29.8 | 40 | 991 | TS · Tropical / subtropical storm |
| 2017-08-30 12:00 UTC | -93.4 | 30.1 | 40 | 992 | TS · Tropical / subtropical storm |
| 2017-08-30 18:00 UTC | -93.1 | 30.6 | 35 | 996 | TS · Tropical / subtropical storm |
| 2017-08-31 00:00 UTC | -92.6 | 31.3 | 30 | 998 | TD · Tropical / subtropical depression |
| 2017-08-31 06:00 UTC | -92.2 | 31.9 | 25 | 999 | TD · Tropical / subtropical depression |
| 2017-08-31 12:00 UTC | -91.7 | 32.5 | 20 | 1,001 | TD · Tropical / subtropical depression |
| 2017-08-31 18:00 UTC | -90.9 | 33.4 | 25 | 1,001 | TD · Tropical / subtropical depression |
| 2017-09-01 00:00 UTC | -89.6 | 34.1 | 30 | 1,000 | TD · Tropical / subtropical depression |
| 2017-09-01 06:00 UTC | -88.2 | 34.9 | 30 | 1,002 | EX · Other cyclone stage |
| 2017-09-01 12:00 UTC | -87.1 | 36 | 25 | 1,002 | EX · Other cyclone stage |
| 2017-09-01 18:00 UTC | -86.4 | 36.5 | 20 | 1,004 | EX · Other cyclone stage |
| 2017-09-02 00:00 UTC | -85.6 | 37.2 | 20 | 1,007 | EX · Other cyclone stage |
| 2017-09-02 06:00 UTC | -84.9 | 37.9 | 20 | 1,009 | EX · Other cyclone stage |
| 2017-09-02 12:00 UTC | -84.7 | 38.2 | 15 | 1,013 | EX · Other cyclone stage |
Sources, rights & limitations
NOAA International Best Track Archive for Climate Stewardship (IBTrACS v04r01), 2017 Atlantic main tracks, accessed October 4, 2026. Basemap: Natural Earth (public domain), U.S. Census Bureau/us-atlas (public domain). Ancient Earth uses the reconstructed source-model land instead.
Data release: ibtracs-v04r01-atlantic2017-20261004. Retrieved 2026-10-04T00:00:00Z. Commercial use: approved. Export rights: approved.
- https://www.ncei.noaa.gov/data/international-best-track-archive-for-climate-stewardship-ibtracs/v04r01/access/csv/ibtracs.NA.list.v04r01.csv
- https://www.ncei.noaa.gov/products/international-best-track-archive
- Historical replay; this dataset contains no forecast or complete impact history.
- USA_WIND is a 1-minute series in knots; no other agency wind estimates are mixed into its category scale.
- Center interpolation is illustrative between recorded times. Intervals longer than 12 hours break the trail.
- Proximity measures shorter great-circle track segments, not documented landfall, storm size, rainfall, or local damage.
- The first public slice contains only the 2017 North Atlantic season; other seasons and basins are unavailable.
Units: wind: knots, NOAA USA_WIND 1-minute sustained wind · pressure: hPa · proximity: km, shorter great-circle segment.
Immutable manifest and asset checksums · Download normalized source scene